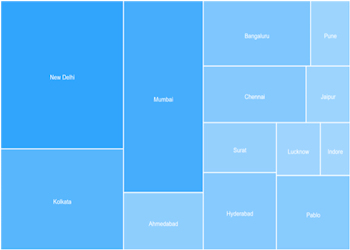

A treemap chart is a data visualization technique that displays hierarchical data in a nested rectangle-based layout. In a treemap, each rectangle represents a hierarchical category, and the size of the rectangle corresponds to a quantitative value, such as a numerical measure or a proportion.
| Created by: | Pablo Software Solutions |
| Added: | July 26, 2024 |
| Last update: | July 26, 2024 |
| Version: | 1.0.0.0 |
| Category: | Miscellaneous |
| Designed for: | WYSIWYG Web Builder 16 (and up) |
| Downloads: | 84 |
| 64bit support: | Yes |