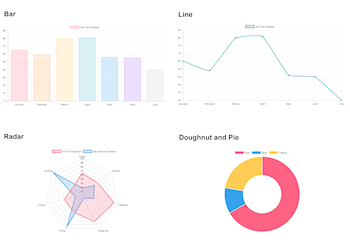

chart.js is a Javascript library that allows designers and developers to draw all kinds of charts using the HTML5 canvas element. For example, line charts, area charts, bar charts, pie charts etc. It’s a self-contained script so it does not depend on external services. The data for the charts can be loaded from different data sources (MYSQL, CSV, JSON, MDB).
• Area, Bar, Column, Line, Stacked, Donut, Pie, Polar area and Radar.
• Load data from MySQL, CSV, MS Access (MDB) or JSON
• Animation support
| Created by: | Pablo Software Solutions |
| Added: | November 20, 2019 |
| Last update: | July 15, 2020 |
| Version: | 1.0.2.0 |
| Category: | Miscellaneous |
| Designed for: | WYSIWYG Web Builder 14 (and up) |
| Downloads: | 1199 |
| 64bit support: | Yes |